

Data alone can “spill some tea” about the state of our district when we allow it to, especially when we examine it with the correct context and alongside other data points. Our inquisitive community continues to ask why our district executives are paid so well while support staff and our educators scrape up what is left. However, executives and elected officials who disagree tend to argue that we are paying the same as the other districts and that our executives are performing comparably to other districts in the state.
We begin our look with executive pay across several districts (information obtained through public records request placed at each district). These districts were chosen based on student enrollment. We wanted to also add some districts with higher enrollment to better understand how much our executives are paid. When placing the requests we asked for all superintendent and assistant superintendents’ pay. While most districts provided prompt responses, we would like to give appreciation to Bay and St. Johns county for their quick turn around and prompt communication with our team.
One district (Okaloosa) included their CFO. We excluded this from the list as none of the other districts included a CFO. However, if we added in Okaloosa’s CFO and still excluded Leon County’s CFO from the total, Okaloosa they would still be spending less on executive salaries than Leon County.

Here is the total executive pay across districts and compared to their total county population and student enrollment. The reason we start here is due to how elected superintendents are paid. Elected superintendents’ base pay is calculated on the total county population. You can read more about it HERE and the statute that limits yearly percentage increases. Appointed superintendent pay is determined by the school board, which may consider several factors such as experience, qualifications, and negotiations for the person in the superintendent position.
We also included in this the percentage of the population of school-enrolled neighbors. This was mostly to highlight how much of our total population is utilizing the public school system. There are obviously other factors that affect this, such as how much of our population are young adults, middle-aged, or geriatric. We would eventually like to also research those numbers and explore what we have here that attracts each age range and what needs to be added to our city and county to encourage more young families to live here and utilize our public schools. Further down in this report we will also discuss the total number of school-aged children in the population and the percentage of those that are enrolled in public school.
Elected Superintendent Districts
- Leon
- Bay (Early resignation by the former superintendent required the appointment of McQueen by the governor. The Bay community re-elected McQueen when elections were held).
- Okaloosa
- Pasco
Appointed Superintendent Districts
- Escambia (currently appointed but voters will decide this year if they want an elected superintendent)
- St. Johns
- Seminole
How Our Superintendent Compares to The Other Elected Superintendents
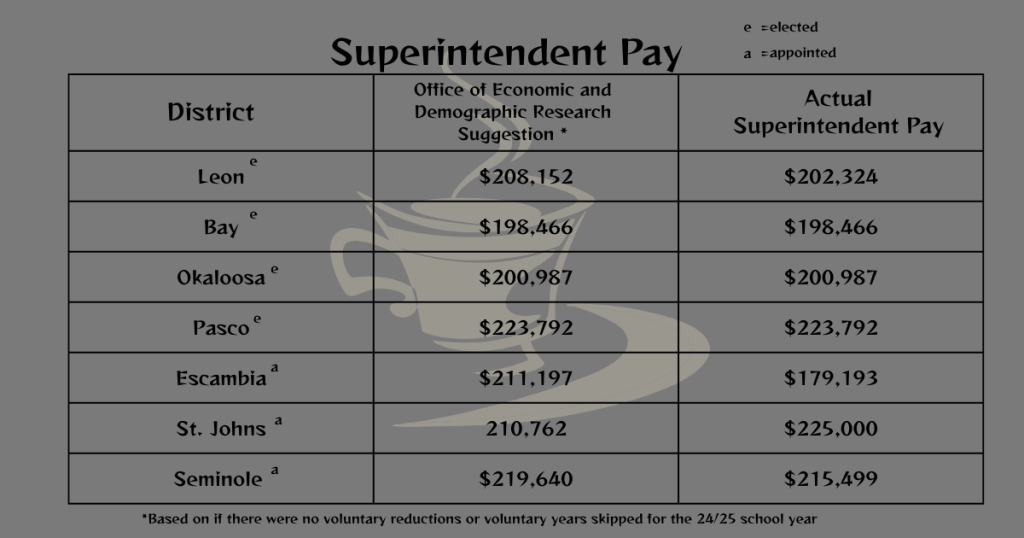
Recently the Leon County superintendent increased his pay by a $42,000+ raise. We covered it in the above linked article. Furthermore, the district maintains that the superintendent pay is set by the state. The district is referring to a published document from the Office of Economic and Demographic Research (OED)1 and it assumes no raises have been skipped; it also states that each district is responsible for doing the equation themselves in order to ensure statutory compliance.
Here is the list of Superintendents and their pay.
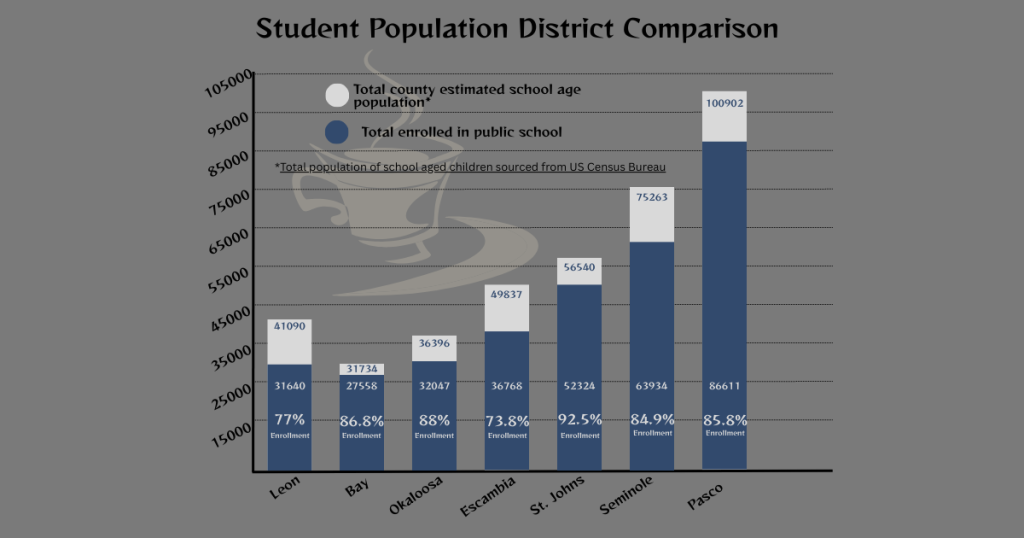
The above figure takes information from the US Census Bureau (Census)2. The age ranges we look at are 5-17 (as the data shows it broken into groups and the groups on either side will falsely inflate the numbers. Be mindful that some families enroll sooner while others may continue to be enrolled past 17 years. Unfortunately the numbers on either side go out about 5 years, so we chose to exclude them from this data).
Here we take the superintendent pay per pupil based on reported enrollment (superintendent pay/enrolled students=amount paid to superintendent per enrolled student). We are not advocating for superintendent pay to be based on per enrolled student at this time but we do appreciate our community that thought to view it this way.
- Leon: $6.39/student
- Bay: $7.20/student
- Okaloosa: $6.27/student
- Escambia: $4.87/student
- St. Johns: $4.30/student
- Seminole: $3.37/student
- Pasco: $2.5838/student
When we apply the Pasco amount per student at $2.58 (rounded) to each superintendent, each superintendent would have the following:
- Leon: $81,631.20
- Bay: $71,099.64
- Okaloosa: $82,681.26
- Escambia: $94,861.44
- St. Johns: $134,995.92
- Seminole: $164,949.72
- Pasco: $223,792 ($223,456.38 when rounded to an even $2.58 like the others)
Disclaimer we are not advocating for this to be a method of calculating salaries. We do find it interesting to see the districts when enrollment and dollar amount are applied equally to each superintendent. Currently there really is not a personal motivation for our superintendents to focus on school culture, parent satisfaction, student success, or any other factor to retain families in public school. If enrollment declines, they get paid more per student to manage fewer students, staff, and schools. If enrollment increases, they essentially are getting paid less per student to manage more students, staff. and schools. Furthermore, when enrollment declines, the state funding then declines, and the superintendent’s pay remains the same, but the teachers’ and students’ resources are then sacrificed to fund the superintendent’s pay– which either remains the same or even increases.
Our question for our community is this: should we continue to pay our superintendents based on the county population or should we add in a public school enrollment factor as well. While it fluctuates, we could rework a beginning of the year enrollment number and an end of the year enrollment number. Then perhaps use that as a factor in our current equation for superintendent pay. Would this be feasible option for superintendent pay while differentiating the superintendents that are promoting public school enrollment from those that are not? Let us know your thoughts.
How Many Executives Are Needed To Run A District?
We focus mostly on our top leaders in the district when we analyze pay and efficiency. This is because leaders are and should be held to a higher standard. When districts are discussing budget cuts and firing hardworking neighbors, or they are discussing cutting programs and resources to the classrooms, we first have to start looking at the executives. We know that leadership begins with sacrifices made at the executive level first, then changes should trickle down from there.
Are school districts with a greater number of executives more efficient/successful than those with less?
To answer this question, we have to define success. Is it enrollment? Teacher pay? Is it district grades? Or is it reading on grade level? Maybe it is a combination of these factors and stating one thing as the success measure is disingenuous to the data. While we understand more factors play a role in the success of a district, we need something that is trackable and easily accessible to measure. For that reason, we are including the enrollment changes alongside our educator median pay as a success measurement as well as economic disadvantage percentages in the public school district.
Below is a scatter plot that shows the number of executives (superintendents included) with the number of enrolled students. The number of executives is derived from our public records request made to each district and the number enrolled is derived from the Department of Education (FDOE).3
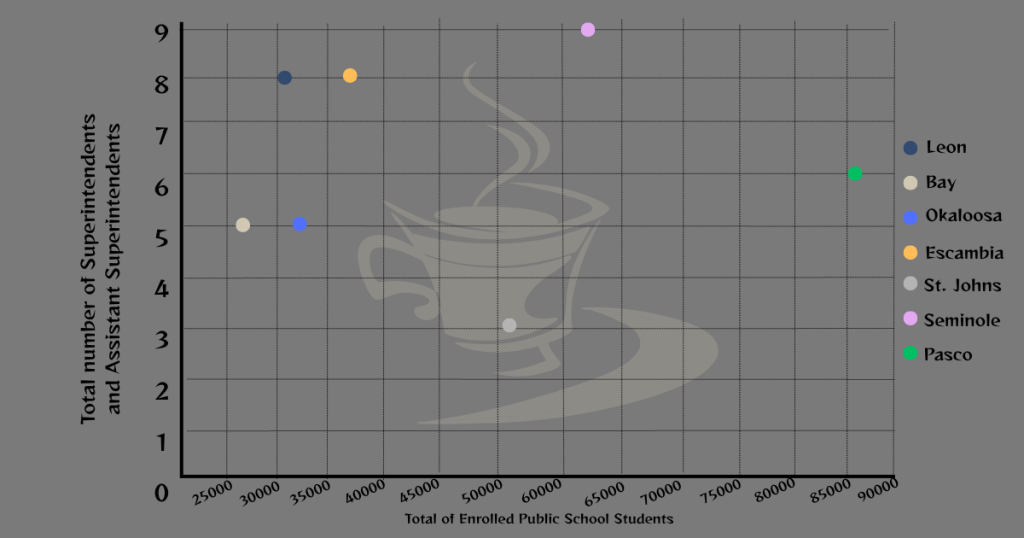
When comparing the number of enrolled students to the number of administrators in other counties we can see that we have three more than Bay and Okaloosa (also comparable in our enrollment numbers) each and that we have two more than Pasco, a district almost three times our size.
However, let’s look at the parameters we discussed as our parameters for measurable success, keeping in mind that these numbers do not reflect the culture or student and parent satisfaction with the district.
District Enrollment
For this percentage we measured the percentage change between school year 2021/22 and 2024/25. When analyzing the information here we see that Bay, St Johns, and Pasco all have less than six executives and all saw an increase in enrollment. Even Okaloosa, who has five executives on staff, saw only less than a 1% decrease in enrollment, while the other districts with more administration all saw greater than a 2.5% decrease in enrollment.
- Leon: 2.8% decrease in enrollment
- Bay: 5.2% increase in enrollment
- Okaloosa: <1% decrease in enrollment
- Escambia: 2.7% decrease in enrollment
- St Johns: 11% increase in enrollment
- Seminole: 4.2% decrease in enrollment
- Pasco: 6.7% increase in enrollment
Leon County specifically has only seen a decrease in enrollment every year since 2021/2022. When we compare Leon County Schools enrollment by population of total school-aged children to those actually enrolled, we are able to see that we have one of the lowest enrollment percentages compared to other counties. Recently, Leon County Schools gave a statement in a news article about the cause of enrollment being a lower birth rate. While birth rates do affect enrollment, so does a district’s culture and treatment of families and staff.
Let’s also look at median teacher salaries.
Median Teacher Salaries (FDOE)
- Leon: $48,775
- Bay: $52,708
- Okaloosa: $51,565
- Escambia: $49,300
- St. Johns: $52,072
- Seminole: $54,606
- Pasco: $51,034
This information means that 50% of our 2,000 educators are making up to $1,275 more than the state mandated minimum. We chose to use the median teacher salary, as the average can be offset from what our educators are experiencing if there are outliers making significantly more. A common saying that we hear frequently from School Board Member Darryl Jones is that if you want to know a person’s priorities, you must look at their checkbook and see where they spend their money. FLCapitalTea agrees with this sentiment. However, not all investments yield the same returns, and the district’s refusal to invest in certain areas indicates where they are misguided in their efforts to improve our schools. Every department is depriving our hardworking neighbors of raises and livable wages. If the district doesn’t invest in the people that run the district, enrollment will continue to decline, and so will funding for our public schools.
District Comparisons
When comparing teacher salaries to executive salaries, our team discussed the importance of also looking at economically disadvantage percentages. Our educators and support staff are our hardworking neighbors. They shop in the same local stores and enjoy the same local entertainment as each of us. Increasing their pay also benefits all of us.
Escambia has the highest percentage of economically disadvantaged publi- school families at 73.8% –that is 14.2% more than Leon County (FDOE). Escambia has the same number of executives as Leon County while only spending $864,921 total on their executives ($136,231 less than Leon County). They also pay their teachers a median salary that is $525 more than Leon County’s median salary. It is important to note that they are the only district on this list that performs worse than Leon County in reading and math at or above grade level and whose graduation rate is lower than Leon County.
Next we see Bay County with 61.3% (1.7% more than Leon County) economically disadvantaged public-school community. However, their median educator salary is still $3,933 more than our median Leon County educators. They also have 1% fewer students reading below grade level and their graduation rate is 6.3% higher than Leon County. They also saw a 5.2% increase in student enrollment since 2021-22, while Leon County saw a decrease in enrollment. Bay County has two fewer executives as Leon County and spends about $352,169 less on executives than Leon County. A final piece of information to note for Bay, is even after the devastating effects of hurricane Michael in their region, they were set up for failure and yet they did not.
While Pasco is a much larger district than Leon County, they have 56.3% economically disadvantaged (3.3% less than Leon County), and Pasco’s median teacher salary is $2,259 more than Leon County‘s. They also have two fewer executives than Leon County and only spend $38,495 more on executives than Leon County. Pasco runs a district that has almost three times as many students enrolled. It’s important to also note that with fewer executives and higher median teacher salary, Pasco has seen a 6.7% increase in enrollment as well as the highest graduation rate of all the compared districts.
The Conclusion of Data Teatime
Conclusions are difficult but in order to make progress towards a better district, we do have to formulate our goal, and every decision made from here on out has to be to get us closer to achieving that goal. FLCapitalTea believes that the success of a district lies in several factors. The first is educator and support staff pay. Employees that are treated well and paid fair wages will be more than just a number on a data sheet. They become stakeholders in the district they helped build and will stay in our community long after they retire. Currently, Leon County schools fail in educator salary. We know from our previous research and observations of board meetings that they also fail in every other department.
The next factor that determines success for us is enrollment. However, it’s not just the base enrollment number or even that it has seen a decline. Comparing this number to total school-aged population in the county and observing how many families are choosing other options is a clear indication of the culture of the school district. Leon County has one of the lowest percentages out of the districts we compared, and we don’t believe these numbers are as simple as “low birth rates” we also feel that boiling it down to just low birth rates invalidates all the families we have personally read and heard testimonies from. Parents want more flexible options; instead of listening to them, the superintendent announced the closure of the only Leon County Virtual option. This will inevitably send our families needing this option to the state program and away from Leon County Schools. Enrollment is a direct numerical representation of our families’ satisfaction with our district. We believe that in data and parent testimony, the district is failing here.
Executive pay wouldn’t be included in our analysis if we didn’t believe it was also a factor. We have more executives than districts with double and triple our enrollment. While leadership is needed in an organization, the saying “too many cooks in the kitchen” does have some truth. While this proverb typically refers to too many ideas resulting in disagreements, it appears Leon County has achieved an inverse effect, and instead no one is contributing to any fresh or sustainable ideas. We believe the tax payer money can be better spent elsewhere.
Finally, we believe that student achievement and graduation rates are a factor in the success of a district. These numbers are a direct reflection of the resources that our district has invested in to assist educators in student success. Nearly half of our students are not on grade level for reading. Our students are doing a little better in math, but recently our district announced it was cutting funding for our literacy programs. We won’t see the effects of these budget cuts immediately and when we do, it will be too late– our students will already be feeling the effects of being at a greater disadvantage.
Unfortunately, with all these factors in play, neighbors will continue to chose to prioritize their life-work balance, their families, and their child’s education. The biggest risk to public schools right now is the local elected officials who refuse to establish goals that would make public education the best option for our community.
We end this report with simple reflections of the achievement and graduation rates listed for your review. We are better and more knowledgeable together.
Achievement Rates
Achievement rates for English and Math are pictured below. The green, teal, and blue all indicate that students are performing at grade level or above. The orange and yellow indicate below grade level. It’s important to also note that at grade level does not mean the student has mastered the material. Many of these students still require support to ensure they do not fall behind in the next year.
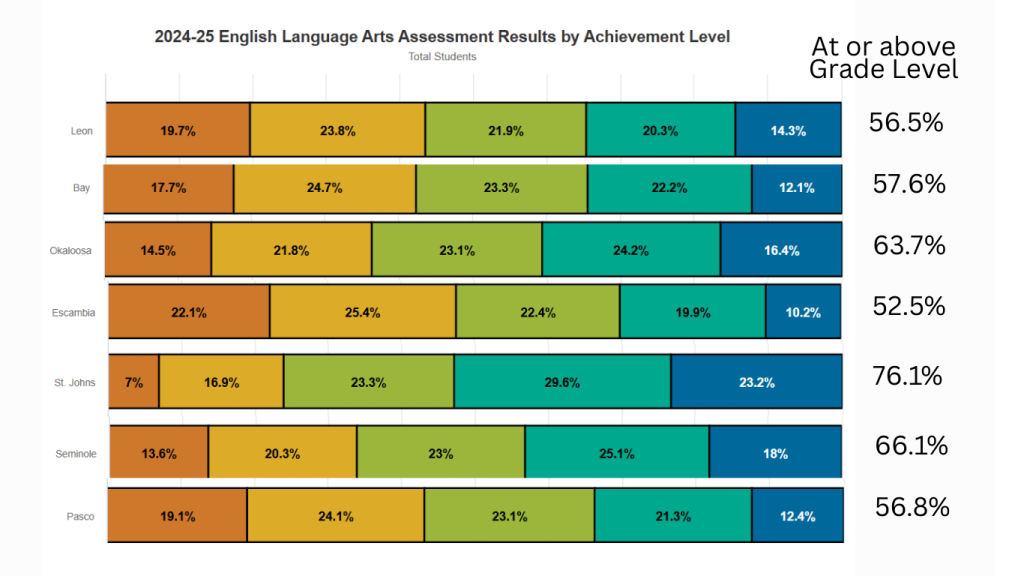
Leon County lags behind all districts except Escambia in English Language Arts. In math Leon County sits in the middle of achievement. The FDOE also has comparisons of science and social studies which we omitted here.

Graduation Rates (DOE)
- Leon: Graduation rate of 85.1%
- Bay: Graduation rate of 91.4%
- Okaloosa: Graduation rate of 87.7%
- Escambia: Graduation rate of 84.2%
- St. Johns: Graduation rate of 95%
- Seminole: Graduation rate of 91.8%
- Pasco: Graduation rate of 95.5%
District Performance (FDOE)
- Leon: Grade of a B the last four years
- Bay: Grade of a B the last four years
- Okaloosa: Grade of an A the last four years
- Escambia: Grade of a B the last four years
- St. Johns: Grade of an A the last five years
- Seminole: Grade of an A the last four years
- Pasco: Grade of a B the last four years
- (OED) Office of Economic and Demographic Research, https://edr.state.fl.us/Content/ ↩︎
- (Census) The US Census Bureau, https://www.census.gov/data/tables/time-series/demo/popest/2020s-counties-detail.html ↩︎
- (DOE) Department of Education, Know Your Schools, 2025. https://edudata.fldoe.org/index.html ↩︎